Understanding test results and data schools share.
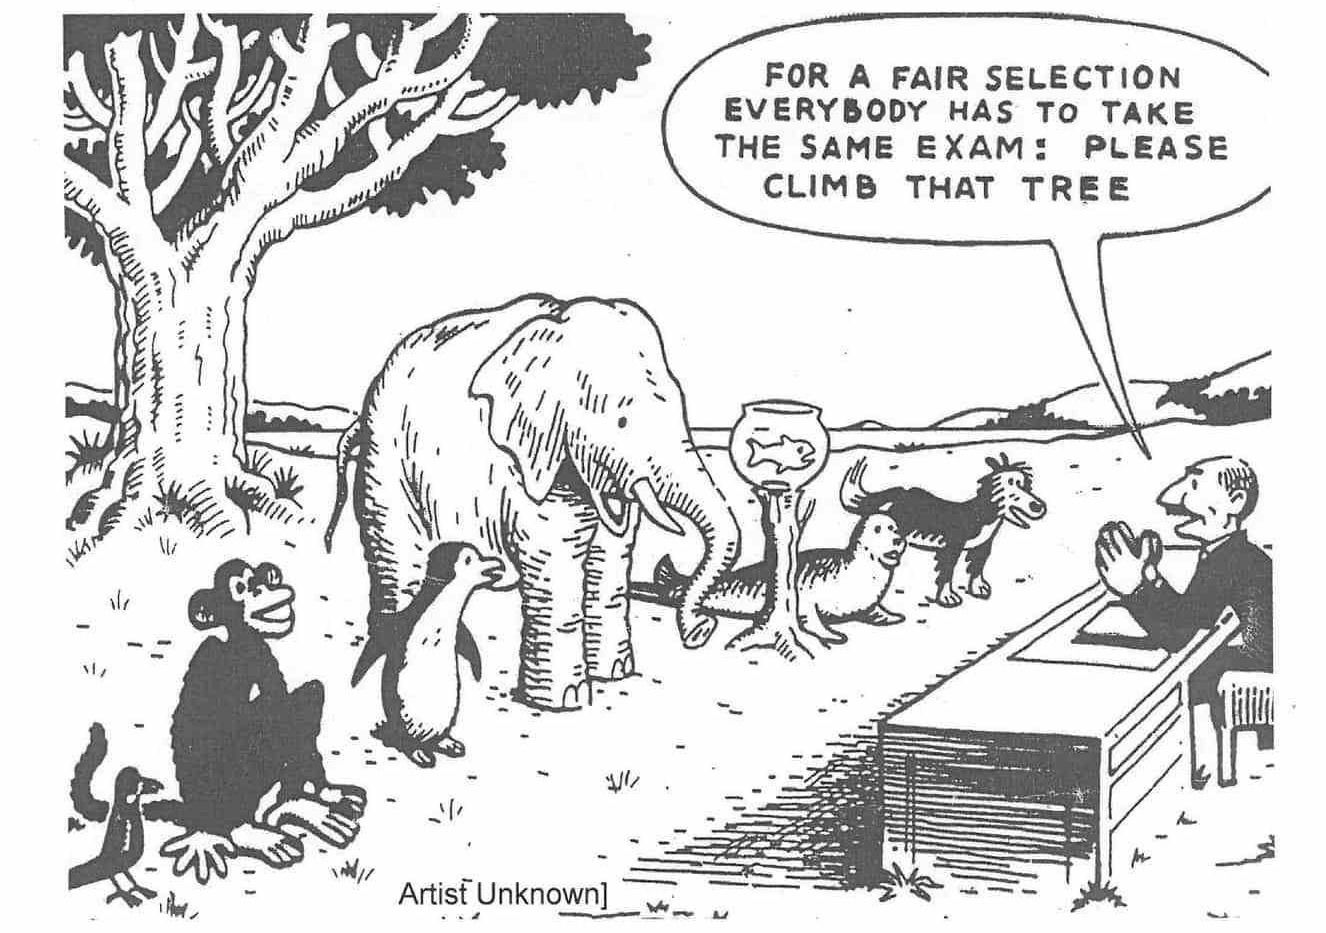
Students are not all alike. Each brings individual skills to the learning environment. Increasingly schools today use test scores. Gathered and used correctly school assessments yield valuable information on how your child learns best. It seems too often that there is lots of "data" but limited understanding for parents, teachers, and school staff on how to use the data to better serve student needs. Assuming all students can meet the same challenges, as the cartoon illustrates, limits. On the other hand if we know what a student does best, especially for students with disabilities, we can design individualized education plans.
Many parents say tests scores are too complex and hard to understand. At Advocate4ed we get that. Other parents say schools hide data. Many parents said data reporting in school meetings makes them feel anxious, nervous, frustrated and even angry because the school excludes them from decision making by using jargon, test scores and data they do not understand Data is important. Data improves student learning if used correctly. Data improves teacher responsiveness to students giving them more time to work with students. Data shows student learning strengths, strengths that can be used to help make up for skill weaknesses. Data shows learning progress. Data is important for children needing special education support especially for students with suspected specific learning disabilities (SLD). SLD is a psychological processing disorder. That can’t be seen. Data show how learning disabilities impact a student’s learning, behaviors, and emotional strength. Data and test scores may seem complex Many parents coach sports, basketball, football, soccer, gymnastics. Sports success is data- based. TV sports casters report individual player data or points scored, overall team data, and the best coaches with the highest scoring teams Schools also collect student data to improve outcomes. Data knowing parents create a home school bridge.
Improving the Score:
A recent University of Virginia student newspaper reported on the value of "knowing the numbers" to increasing team success. The article Dribbles and Data: How UVA Leverages Science To Build Better Basketball Players is a starting point point to knowing the why of educational data and h ow to really use it to help students achieve school success. “If we can make our athletes happier, healthier and just better functioning as humans, that’s huge.” Natalie Kupperman, assistant professor in University of Virginia’s School of Data Science, (2023) said. “The team’s practice is packed with data collecting used to pinpoint how to improve player and team outcomes.”

Imagine if we could do the same thing for students at risk, students needing more support in school, students with specific learning disabilities (SLD). Using data, data leveraging, is not a new idea. Education data increases each year. The government collects data, states collect achievement data, schools collect data, and teachers collect data on your child. The important question is do we use the data we collect well? Does the data collected reduce the cost of education, reduce the stress on students and your families to improve your children’s sense of self and set them on a path to successful adult lives? Imagine benefits beyond improved education for your child. Data understanding reduces school costs, and your taxes, if legal challenges are reduced and if individualized services under IDEA better meet a student’s needs. Data knowledge can reduce the amount of time you lose from work to attend meetings and it can reduce sense of marginalization, frustration, anxiety and tension parents report feeling so often in school SLD decision making school meetings. And, it improves student outcomes.
 It is important to be able to really understand the data you use. But we get it. Data can seem complex. So, SPARK begins with the end, a form to fill in. This section briefly explains the models and data you need to complete the SLD screening form. An SLD parent screening form is filled in to show how it looks with data.

a) RTI screening tests such as MAP, iReady and PALS compare one child to the general group of children being tested. Scores are presented as raw score, ranges, or percentile. Percentile scores are used to determine need. Schools often use a screening score cut off score of below the 20th percentile. Those below the 20th percentile will receive intensified instruction. Billy’s screening for overall reading was at the 11th percentile. Scores are plotted to show progress or lack of progress. RTI does not determine a psychological processing weakness. RTI does not look at overall thinking ability. RTI can’t identify a learning disability without other data. RTI does show academic achievement deficits. Teachers then intensify instruction to improve achievement. More data is needed to identify SLD. As shown in the table above percentile scores can be plotted to show academic progress. The school can also determine a rate of progress using the data they have. In Billy's case you can see his reading scores were declining. The parents brought in a tutor and look what happened. We do know if he has a learning disability. We do know he is struggling in reading and the current reading ;program used by the school does not seem to be helping. The tutor really helped but maybe that is because he thrives on one to one attention provided by the tutor or maybe the reading class is right before lunch and he is thinking food not reading. We know his reading skills were declining but we do not really know why. More information, data, is needed. It is important, though, for parents to request the screening test results in the lower elementary grades. The tests such as iReady are called universal screening tests and they are usually given three times a school year to monitor educational progress.
If Billy's screening percentile scores continue to decline it is time to request a child study meeting. The child study team will now look at what data they have. Should they take a different approach to reading instruction or should the school gather more data of cognitive, psychological processing abilities and more standardized assessment of educational achievement compared to national normative data. Now the discrepancy and strength weakness models come into discussion.
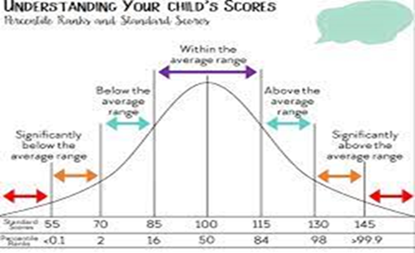
b) A discrepancy model uses cognitive, psychological processing and current achievement levels. Tests results are presented in standard scores. A child’s scores are compared to that child’s other scores. With standard scores the average score is 100. The figure shows how scores range and it also has percentile scores for comparison as well. The cognitive psychological processing, IQ, score is compared to a standardized achievement test score. If Billy has an overall IQ of 106 but a reading comprehension standard score of 76, (106-76=30) the difference is significant and a learning disability in reading could exist.
c. The strength-weakness model uses the same data as the discrepancy model. It requires a significant psychological processing weakness as well. That weakness needs to relate to the area of achievement deficit. Billy might have an overall cognitive ability of 106 and reading achievement score of 76 but now a psychological processing disorder, such as a visual-spatial ability score of 81, much below his overall ability, would exist if SLD is present. Billy’s significant weakness in reading is likely due to problems in visual-spatial abilities. He has the overall ability for school success.
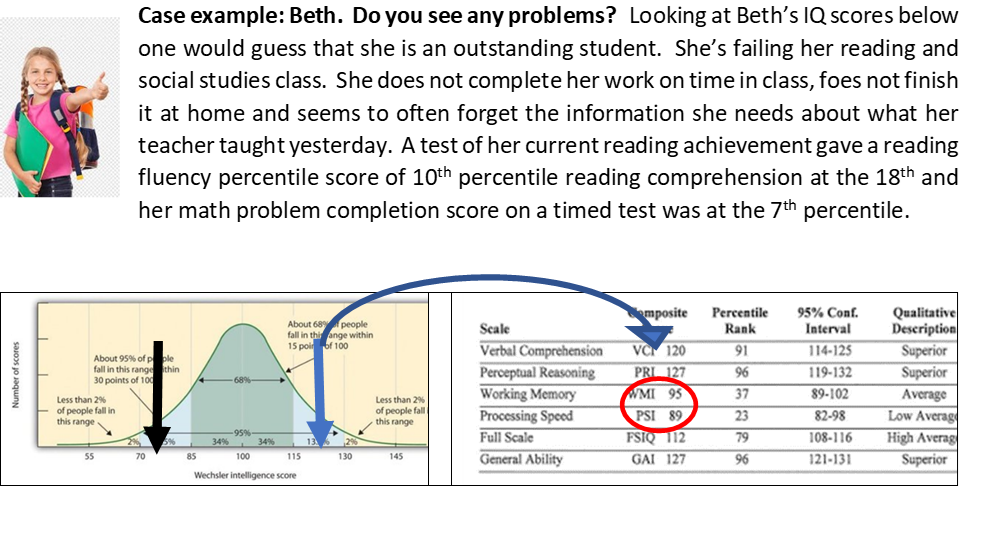
Now let’s apply each model to the limited information we have on Beth. She is 8. Third Grade. Her school record probably has a lot more supporting information that we can add as well but the goal here is to see how easy it is to apply data to a form you can use in the meetings as a guide
Most school psychological and educational reports today include a final summary page of the standard scores. You can use those tables at the end of the psychological and educational reports to get a good start on understanding what the school is saying in an eligibility meeting. Are they saying Beth is below her classmates in reading using RTI or are they looking at her discrepancies and psychological processing strengths and weaknesses.
Summary: All models must show (1) academic underachievement. Discrepancy model shows significantly low achievement compared to cognitive potential, (2) Strength –weakness shows how low achievement due to psychological processing weakness compared to cognitive strengths. Applying the 3 models in Beth’s case what do you think? (3) RTI does not look at psychological processing. Know your school’s SLD model.
Remember the 3 Knows. Which boxes or data on this table do you think will be most important? What type of data has most added value for your presentations or understanding in school meetings? What test scores allow you to really collaborate? Guidelines of the types of data you will look for.
|
T